Makeover Monday 2019/W33 - A bird’s-eye view of clinical trials
This week’s data was provided by the Aero Data Lab and it contained information on more than 13,000 clinical trials from 10 different pharmaceutical companies, along with the trial title, summary, status, number of human subjects enrolled and more. The original visualisation aimed at providing a bird’s-eye view of hundreds of different conditions by displaying all of these characteristics in a single graph, at the same time. The accompanying article highlights the importance for pharmaceutical companies to visualise this information in order to understand which conditions are being studied, who is investing in them, if the trials are being completed, and if there are any areas which are being neglected. This is what a portion of the original visualisation looks like:

My thoughts on the visualisation:
What works with this chart?
- It offers a very impactful view of many conditions at once, allowing the viewer to see gaps between trial starting dates, to gauge the overall size of the trials (i.e. enrolment numbers), and determine whether there is any unusual amount of terminated ones;
- The viewer can interact with a specific trial of interest by hovering the mouse over its bubble, and click it to be brought to its registration page.
What doesn’t work with this chart?
- The very small space separating each condition makes it virtually impossible to determine to which condition larger bubbles belong to;
- Discerning between 10 different colours is not always straightforward, especially when bubbles overlap, also making the graph inaccessible to colourblind viewers;
- There is no way to isolate a specific condition, company, or trial status in order to filter down the visualisation and gain more specific information if needed;
- The extreme height of the graph makes it very difficult to refer to the x axis (Trial Start Date) quickly if one is looking at a condition that is not immediately at the top;
- Overlapping bubbles might lead a viewer to accidentally visualise information from a nearby trial instead of the one they intended to focus on;
- Overall, the graph is often overcrowded and messy, which can be discouraging to less trained viewers and prevent them from gathering the information they actually need.
How can it be improved?
- For a graph containing information from 10 different companies, about trials which could have 9 possible statuses, and covering a whopping 867 different conditions, the only way to maintain a bird’s-eye view while also preventing clutter and allowing more detailed information to be gathered was, in my opinion, filters and multiple graphs;
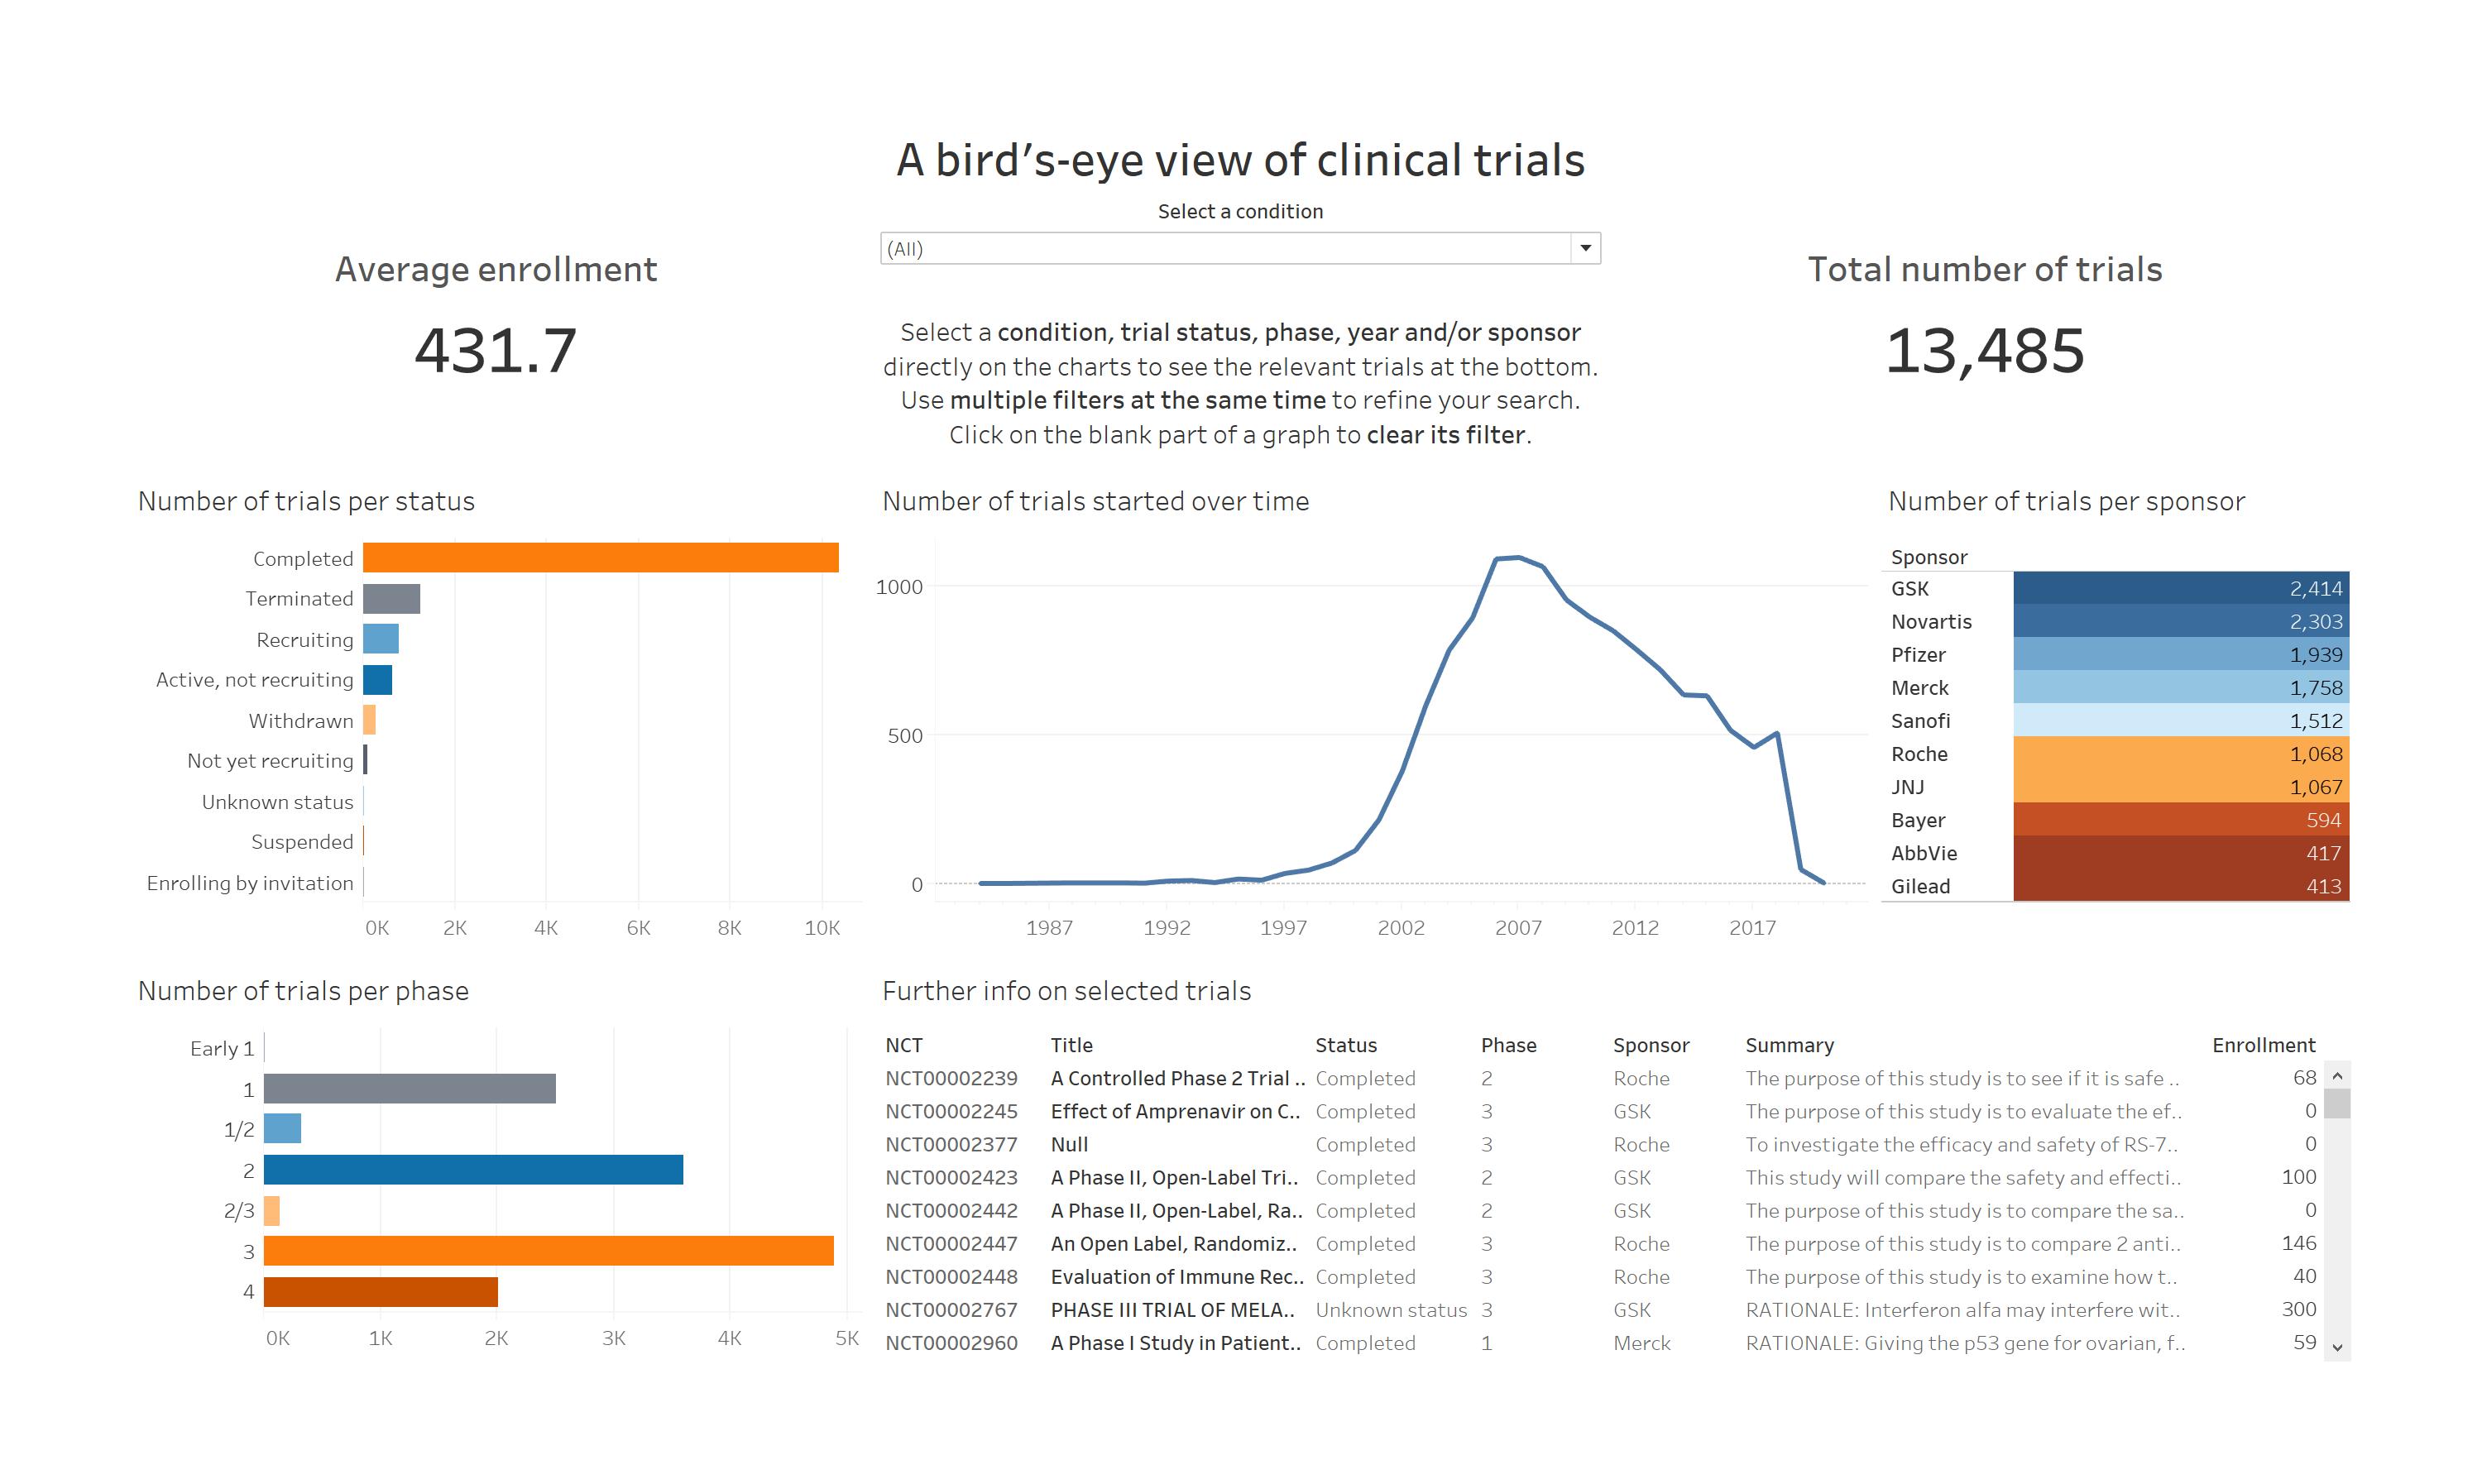
- Using the article related to this data as a guide, I asked myself: what information would I want to see about a condition?, and tried to answer that in a single dashboard. I made it possible to see, either for all conditions or for one in particular:
- Who is investing in it? (number of trials per sponsor)
- What is the status of these trials? (number of trials per status)
- When is work not being done? Has this condition been neglected in the past few years? (number of trials started over time)
- What are the most common phases for these trials? (number of trials per phase)
- Where can I find more information about the trials I am interested in? (further info on selected trials)
- With all these different graphs and filters, people can get an overall idea of the trends that trials are following either in general, for a specific condition, or based on their characteristics (status, start date, phase etc.), all while keeping different information clearly separated;
- All the selected filters act on the list of trials at the bottom of the dashboard, where the viewer can find out more about each trial without risking clicking the wrong bubble, and without having to limit themselves to seeing one trial at a time only.
Interactive dashboard
How did I do it?
Unlike last week, this time I started the analysis in Python, using pandas to have a look at the unique values in the various columns, identify missing values, change the formatting of the phase column, and finally merging each start year and start month in a single datetime object.
As usual, the individual plots are not that difficult to pull off. The main challenge I had with this dashboard was to make sure all the filters were working properly and acting on the right target. One thing I did not manage to do which I would have liked is to add a “clear all filters” button. While testing multiple filters at the same time, in fact, I found it is extremely tedious to undo each filter for each graph manually, and for some of the smaller graphs this can be outright frustrating. However, even if all the tutorials I saw pointed in the same direction, I could not seem to make it work. If anyone can offer any guidance on that, I would be very grateful.
A final, quick note on the dashboard regards the number of trials per status and per phase visualisations. Like everyone else, I was tempted by pie charts for those sections - well, I quickly changed my mind. When using pie charts, it was almost impossible to filter for the trials with the smallest slices of the pie, and some of the categories ended up almost disappearing. This only consolidated my belief that pie charts should be avoided basically always.
Final thoughts
Second week of Makeover Monday, done! I am very happy with my entry for this week, especially considering how huge and varied this dataset was and how chaotic the results could have been if one did not know where to look. I am starting to take a few steps towards trying to make my dashboards not only useful, but pretty to look at, while still maintaining my data/ink ratio as small as possible - and I feel quite satisfied with that too, with this one. In the future, I might try to find a way to remove graph titles, and maybe add a bit of explanatory text to the dashboard. Can’t wait for next week!